Metrics from our dataset
Thanks to HFCommunity, we can extract interesting metrics from our data. In the following we show some basic examples of the metrics that can be extracted from our dataset.
(All graphs and results in this page were calculated on Sept 1, 2022)
Which organization is the most active?
How many files does a repository usually have?
It is interesting to know which organization is the more active one creating models in Hugging Face. In the following chart we can see that this organization is huggingtweets, but there are other well-known names too, such as Google or Facebook.
Here we show the number of files a repository usually has. For example, the first case tells that 14.8% of all repositories in the Hugging Face Hub have only 1 file, which may reveals toy or test projects.
How often a file is modified in a repository?
Does it have an associated paperwithcode?
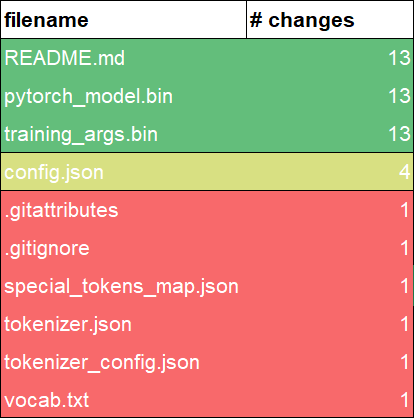
When analyzing repositories in code hosting platforms, one thing usually overlooked is which files are more often modified. This could give us a hint of how the work is organized. As example, the following table represents a heatmap of file modifications in the repository model: distilbert-base-uncased-finetuned-ingredients.
Some dataset repositories have an associated paperwithcode element. This platform is used to upload the code of a research/white paper so it is easier to replicate the work.
How many repositories have discussions?
How discussions are used?
One key aspect of the Hugging Face Hub, and recently added, is the pull requests and discussions. This feature enables the collaboration among all community members. But as we see in the following chart, very few repositories leverage on this functionality.
As we have seen, few projects draw on discussions. Besides analyzing the use of discussions, another interesting metric is how much these discussions are exploited. Here we show the number of repositories grouped by the number of discussions and comments. As we can see, most repositories only have one thread of discussions.
How many comments have discussions in the Hub?
How many discussion threads are not created by the owner?
We have seen that most repositories have just one discussion, but another element to consider are the comments in the threads of discussions. Hence, we show how many comments by average have the discussions in each repository.
Another relevant detail about discussions is who create them. Here we are trying to detect whether the discussions are started by the owner of the repository or not. As we can see, the vast majority of discussions are not created by the owner. The chart is visualized using a logarithmic scale.